Tracking your website stats is important. Website stats and traffic data allow you to keep track of where your site is heading and what can be improved on.
By being able to track the results of different marketing strategies, you can fine-tune your campaigns and be more productive.
In addition, stats are important for other reasons.
For example, if you know the demographics of your website visitors, you can display ads and offers that are best suited for them.
You can also find out which kind of content brings the best results.
Google Analytics is probably the most well-known website traffic software out there. It is free to use – all you need is a Google account.
However, it is not the only one available to you. Another popular tracking software is called Improvely.
Improvely is an advanced software that is geared specifically towards marketers and affiliate marketers.
The data that you can get by using this tool will allow you to fine-tune your marketing campaigns and get a better conversion rate and more sales.
Continue reading for reviews of both Google Analytics and Improvely so you can compare them and decide which one is best for you.
Google Analytics
Google Analytics is owned by Google, so it has a lot of brand recognition.
In addition, it is free to use and very easy to install and set up (all you have to do is paste a tracking code on your website, and there are many WordPress plugins that make it easy for you by giving you a field to paste the code into).
Because of this, it is widely popular and used by many businesses, if not most.
Even businesses that use premium analytic tools usually have Google Analytics as well, as it costs them nothing extra.
The Dashboard
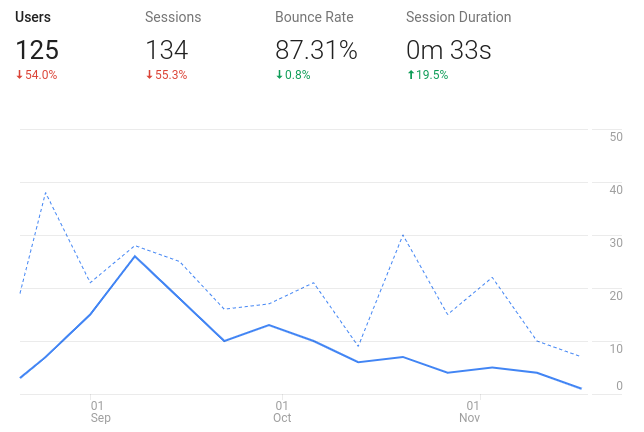
Google Analytics has a simple interface. In your dashboard, you will get quick stats about your site.
This includes:
- Users
- Sessions
- Bounce rate
- Session duration
For each of these four stats, you will see by what percentage they have gone up or down compared to the prior period of time.
You can choose different time ranges, such as the past seven, 30, or 90 days.
There will also be a graph giving you a quick view of your traffic over that period of time and its fluctuations.
On the right-hand side, you will get a live view of how many visitors are on your site at the current moment.
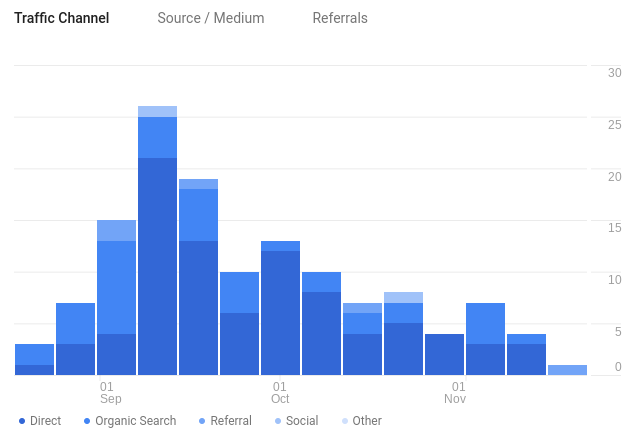
Scroll down and you will see where your traffic is coming from.
This includes data about traffic channels, sources (such as search engines), and referral sources.
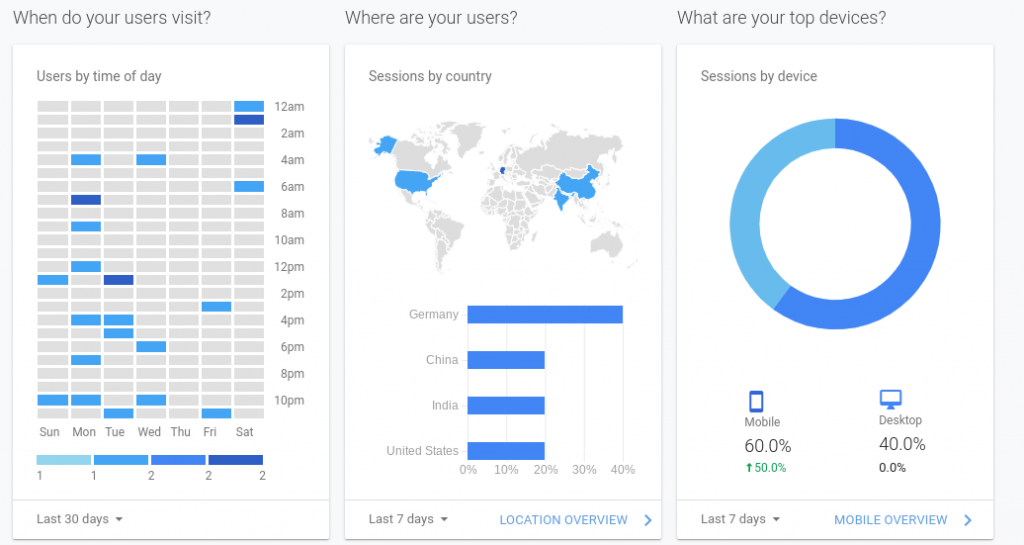
You will also get more graphs and information further down:
- Active user graphs
- User retention bar charts
- Most popular times of day charts
- Country maps
- Device pie chart
- A list of pages that are the most visited
- Goal tracking
For each of the above, you can click on the graph or chart to see more detailed analytics.
Related: How To Use Google Analytics To Improve Conversion Rate
Customized Reports
You can also customize your reports and save them so you can see the specific data you are looking for.
Real Time Reports
Real Time Reports give you insights into what people are doing on your site at the current moment.
It includes data such as pageviews per minute, top social traffic sources, top referrals, top active pages, and top locations.
You will also see which content your visitors are currently viewing.
If you have set up any conversion goals or events, you will get data for that as well.
Audience Reports
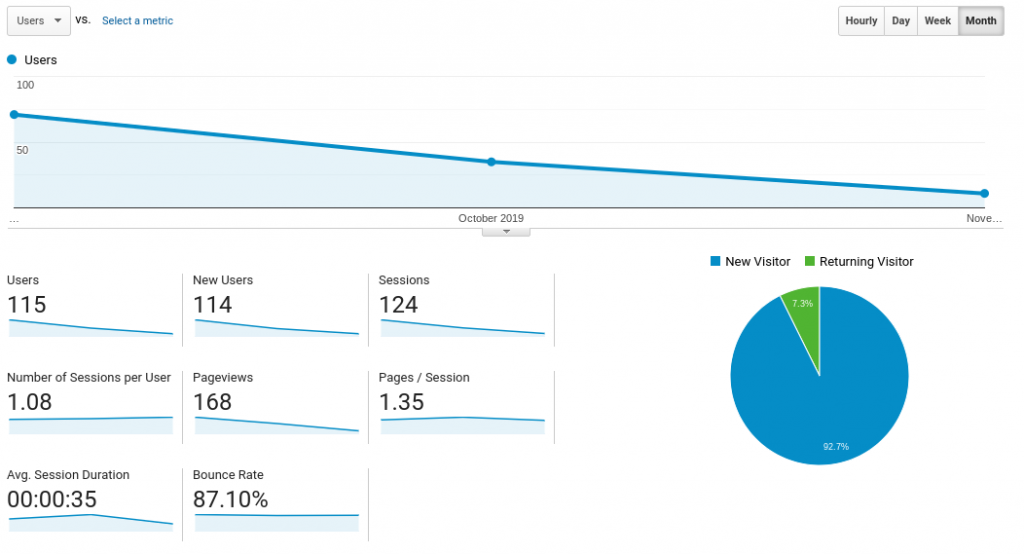
Your Audience Reports section is probably the most important thing you should be looking at. Here is what you will see:
- Users – How many visitors in a specific time frame
- New Users – The number of new visitors who visited your site for the first time during that time frame
- Sessions – How many sessions (some users will visit more than once)
- Number of Sessions Per User – On average
- Page Views – Some users will visit multiple pages in a single session
- Pageviews Per Session – On average
- Average Session Duration
- Bounce Rate
Below that, you will be able to go further and see demographic data such as:
- Languages
- Countries
- Cities
- Browsers
- Operating systems
- Devices
- Mobile operating systems
- Mobile service providers
- Mobile screen resolutions
This is all in the dashboard under Audience Overview.
There are additional sub-sections, including:
- Active Users
- Lifetime Value (Revenue per user in first 90 days after acquisition)
- Cohort analysis
- Audiences
- User Explorer
- Demographics (Overview, age, and gender)
- Interests (Affinity, categories, in-market, and more)
- Geo (Language and location breakdown)
- Benchmarking (Channels, location, and device)
Here are some additional sections in Audience Overview you might find interesting:
- Cross Device – Information about device overlaps, device acquisition, device paths, and channels
- Behavior – New vs returning visitors, frequency and recency, engagement, and more
- User Flow – This shows you the paths users take in different countries
- Technology and Mobile – Breakdowns of browsers, operating systems, devices, and more
Related: Best Google Analytics Alternatives
Acquisition Reports
Now that you know everything you need to know about your users, you can find out where they are coming from and how you are acquiring them in the Acquisition Reports section.
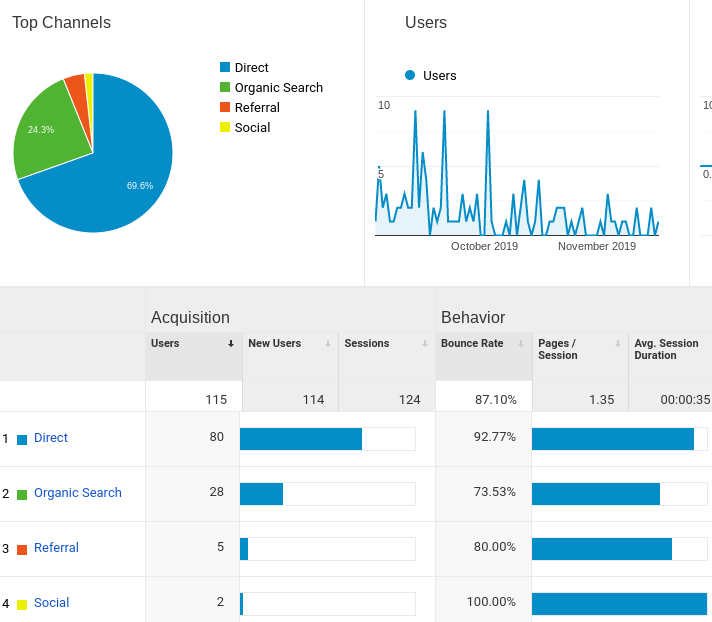
In the Overview section, you will see a pie chart and graphs detailing the percentage of users coming directly to your site from social media, through organic searches, or through referrals.
You will also see analytics for each one, such as new users, sessions, bounce rates, pages per session, average session duration, goal conversions, and more.
In the All Traffic section, you can see acquisition channels, sources and behavior breakdown, referral sources, and treemaps.
In the Google Ads section, you can see things such as keywords, search queries, and campaigns.
In the Search Console section, you can see data about landing pages, countries, devices, and more.
The Social section will show you which social networks you are getting traffic from, including landing pages, network referrals, conversions, and user flow.
Finally, there is a campaign section to track your organic and paid campaigns on Google.
Behavior Analytics
Now that you know who your visitors are and how they are finding you, you can take a look at what exactly they are doing on your site.
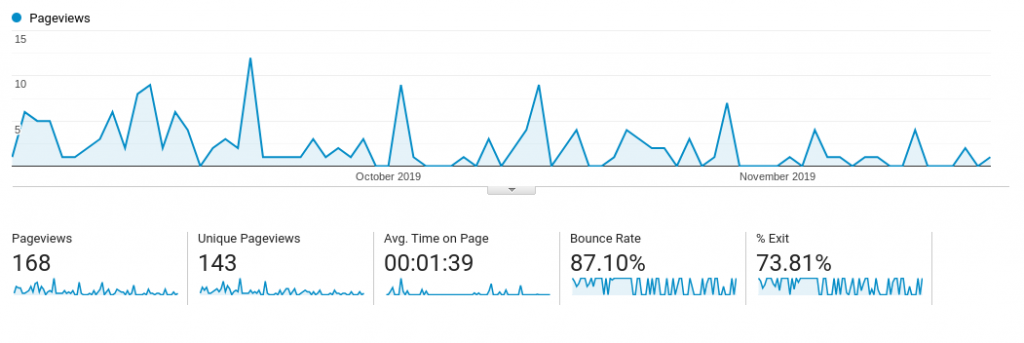
In the Overview section, you will get a quick view of:
- Pageviews
- Unique pageviews
- Average time on page
- Bounce rate
- Exit rate
- URLs visited
- Page titles visited
- Search terms used on-site
- Events
In the Site Content sub-section, you will see data for all pages visited, including their respective pageviews, unique pageviews, average time on page, etc.
You will also see which pages people landed on and which pages people exited your site from.
The Site Speed section is particularly useful, as you can see how long it takes for your pages to load, including deeper data such as average server lookup time.
You will also get suggestions for how to speed up your site’s loading times.
There are some more sections, such as site search data and events breakdowns.
Additional Tracking Capabilities: Events, Goals, Conversions
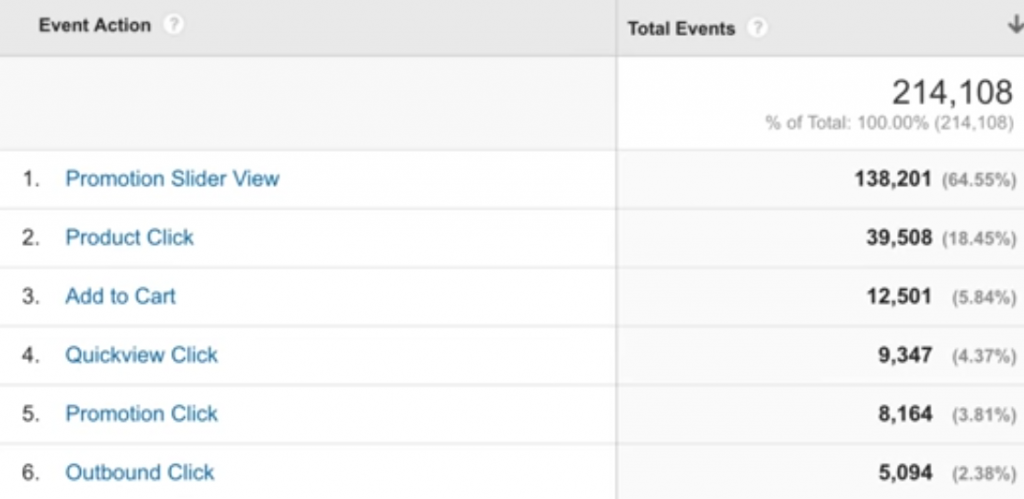
Google Analytics lets you track events, which are actions that are not usually tracked.
For example, you may want to track clicks to an external website or PDF download.
You can do so with events tracking, and you can also control when the event tracking is triggered.
All this can be controlled in the Google Tag Manager (more on that below).
What if you want to set up goals? For example, a goal can be signups to your email newsletter.
You can do this with Google Analytics’ conversion tracking tools. What you will need to do is place a tracking code on a certain page, such as a thank-you page on your website, that users are directed to after they sign up to your email list.
Some affiliate sites will even let you place this tracking code on their own site.
This way, Google Analytics can track how many conversions you have and keep you updated on how close you are to your goals.
Related: Best Google Analytics Plugins For Woocommerce
Google Tag Manager
Google Tag Manager, which can be accessed from your Google Analytics account, allows you to add code to your website for a variety of purposes, including tracking.
There are code templates made for you already, and you can create your own custom code.
Instead of always having to code Javascript on your website, what you can now do is control everything from your GTM dashboard.
Using the code, you can do things like keep track of your ROI. You can add conversion scripts or event trackers, as well as define tracking rules so that they are triggered when a certain page is loaded, etc.
Everything can be edited from the Google Tag Manager interface, so there is no need to go into your website code and start playing around.
Essentially, Google Tag Manager is like a toolbox for editing your tracking codes.
Google Analytics 360 Premium
Although many people do not know this, there is actually a premium version of Google Analytics, known as Google Analytics 360.
If you are wondering how much it costs, the answer is a whopping $150,000 a year.
You may be wondering why any business would pay such a large amount for analytics, and the answer is that for most businesses, it is unnecessary and too expensive.
It will give you access to more advanced analytics and unlimited data restrictions.
However, it is more suited to someone whose business is analyzing data.
Unless you operate a large research company or are otherwise responsible for analyzing large amounts of data, Google Analytics 360 isn’t for you.
Improvely
Improvely is a tracking software that is especially useful for tracking conversions.
People who might find it useful include affiliate marketers, affiliate vendors, and solo ad sellers.
Traffic and Conversion Reports
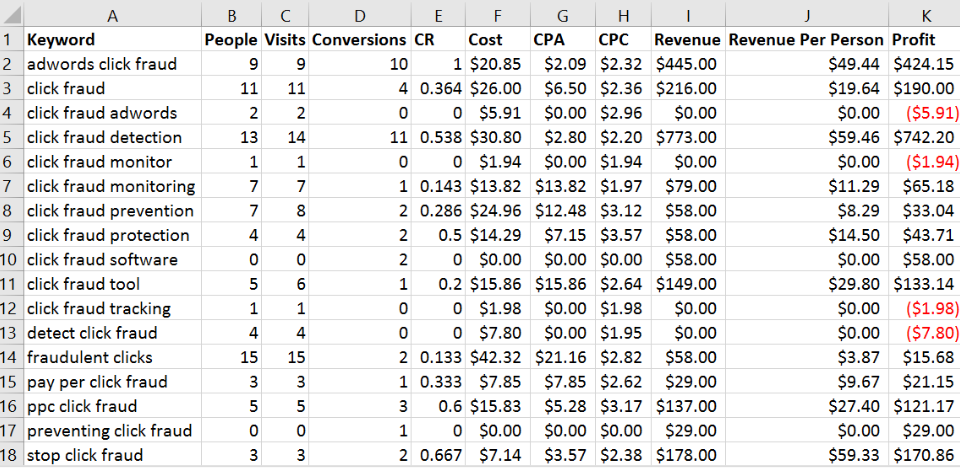
In the Traffic Reports section, you will see a list of all your traffic sources. For each source (for example, Google Adwords, Bing Ads, or your own email list), you will be able to see:
- Number of visits
- Number of visitors
- Number of conversions
- Overall conversion rate
- Your total cost
There are plenty of other data points you will see as well, including:
- Channels
- Referral sources
- Sources
- Landing pages
- Keywords
- Search phrases
- Countries
- Cities
- Devices
- Days
- Unique visits
- CPA costs
- CPC costs
- Revenue
- Goal values
- RPP
- ROI
- Average customer value
- Profit
Related: Clicky Web Analytics Review
Custom Funnel Reports
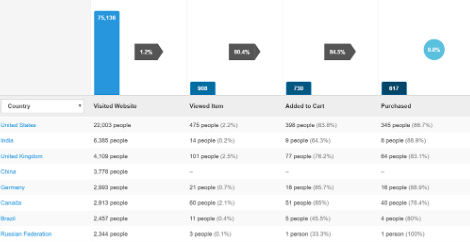
Funnel reports allow you to track how visitors go through your funnel.
For example, if you have a checkout funnel, you can see how many people added a product to their shopping cart and how many people actually made a purchase.
This can help you figure out things such as cart abandonment rates, which you can improve by working on things such as checkout page load times, an easier checkout process, and better shipping options.
You will also see this data broken down by country for more specific data.
Customer Profiles
This is something that Google Analytics does not offer.
Google Analytics tracks sessions and gives you an overall review of what your traffic is doing on your site and where they are coming from, but you won’t get any specific information about any user.
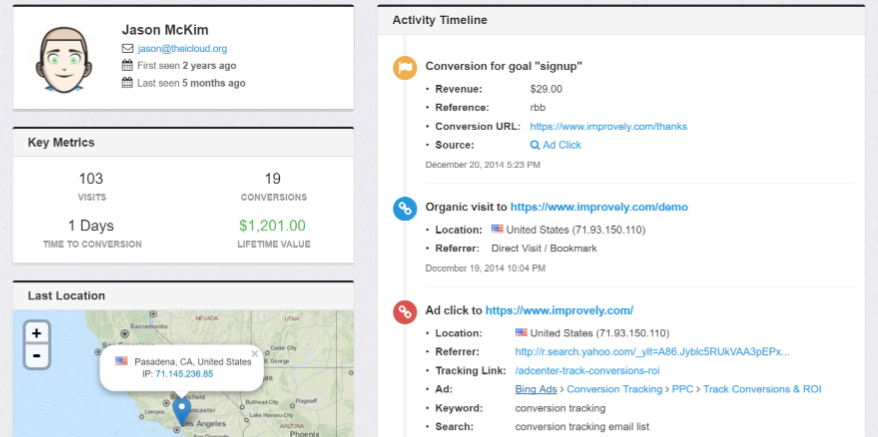
However, Improvely does create a customer profile.
This profile is composed over time, based on a customer’s or visitor’s actions on your site over weeks or even months.
Each customer will get their own profile.
It will include their name and email (which you will have if they made a purchase from you), as well as key metrics, such as how many visits they made to your site, how many purchases they completed, how long it took to convert them into a paying customer, their lifetime value, and even a map showing their last logged-in geographical location.
It will also give you a detailed list of their recent activity.
You will see their conversions or purchases, including their traffic sources and how much revenue you made, and any other visits or ad clicks.
This way, you can find your most valuable clients and see what ties them together.
Once you know what they are interested in and what their habits are, you can better serve them.
Click Fraud Monitoring
If you buy clicks, whether through solo ads or some other method, you need to make sure that you are not receiving fraudulent clicks.
Fraudulent sellers might send you clicks from bots to make you believe you are getting more traffic than you truly are.
Not only does this cause you to lose money, it will also distort your conversion rate statistics.
You will never know your true conversion rate, as none of the bot clicks can be counted.
Fake clicks can come not just from fake publishers selling you ads, but also from competitors who want to make you pay money for clicks that you shouldn’t be paying for.
If you are paying per click, it is essential to block these fake clicks.
Improvely says that according to Click Forensics and Anchor Intelligence, up to 29 percent of clicks received from paid ads are fake.
Improvely will monitor your traffic at all times of the day and night.
They will be able to detect suspicious clicks as they happen.
If they do detect fake clicks, they will generate a fraudulent clicks report.
This report will include information such as from which IP addresses the clicks are coming from, their referrers, and the dates and times the clicks occurred.
Knowing which IP addresses are sending fake clicks can help you track who is sending them.
You can then submit this report to the platform you are using for your paid ads campaigns.
This is the best way to get a refund for those fake clicks.
You can also block IP addresses which are sending fraudulent clicks. And, if your competitors know you are monitoring your clicks, they will be less likely to attempt any shady business for fear of being found out.
Related: Improvely Review
Affiliate Conversion Tracking
We mentioned that affiliate marketers could benefit from Improvely.
This is due to their affiliate conversion tracking tools.
Improvely shows you which keywords, campaigns, landing pages, ads, and more are bringing in sales and commissions and which ones aren’t.
You won’t have to generate a new referral link for every keyword.
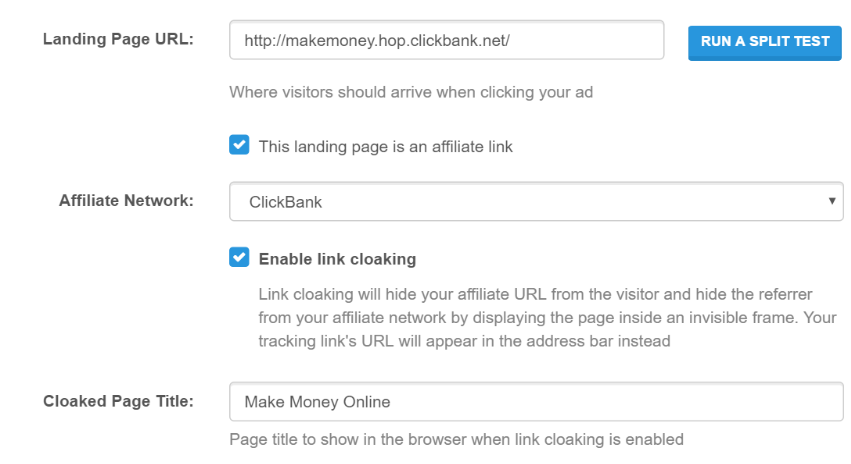
You can cloak your affiliate links, which has two purposes.
First of all, it prevents the owners of the product you are promoting from seeing where your traffic is really coming from.
There is always the risk that if a product vendor sees that you are getting a lot of high-quality traffic from a certain source or advertising platform, they will try to get the traffic from that place themselves so they won’t have to pay you any commissions.
In addition, it allows you to control the URL and site title you show to your visitors.
You can make it look more professional instead of just having a long URL with various characters that make up your affiliate ID.
Most affiliate networks will work with Improvely.
As long as you can add a SUBID to your links or use tracking pixels, you can use Improvely’s affiliate tracking tools.
Examples of networks you can use with Improvely include Clickbank, ShareASale, Commission Junction, MaxBounty, Linkshare, and many more.
A/B Split Testing
You can test out different offers through the A/B split testing tool.
By switching up your offers, you can find out which ones convert the most.
It’s not just offers you can split-test.
You can also split-test different landing page versions for the same offer without getting approval first from the product owner.
In-Depth Dashboard Stats
In your dashboard, you will see a quick view of your stats.
At the top, your traffic will be divided into three types: organic traffic, search traffic, and ad traffic.
For each of these and for their total, you will see your total visits and conversions.
There will also be a bar and line chart that shows you traffic and conversion fluctuations over time.
Here are some other stats you can see in your dashboard:
- People
- Visits
- Converted customers
- Goal conversions
- Conversion rate
- Total cost
- Average cost per acquisition
- Average cost per click
- Total revenue
- Average goal value
You can export all of your reports at any time.
Related: Ultimate Guide To Setting Up Google Analytics For Your Mobile App
Agencies
You can use Improvely as a white-label service.
If you want to provide analytics and click fraud protection services to your clients, you can do so via Improvely.
You can control everything from a central dashboard and offer your clients the same benefits mentioned above, such as the ability to see all their stats from a central dashboard and instant email alerts and notifications about traffic or conversions/sales.
You can use your own domain and branding.
If you want, you can offer click-fraud monitoring or other services as premium services for additional revenue.
Pricing
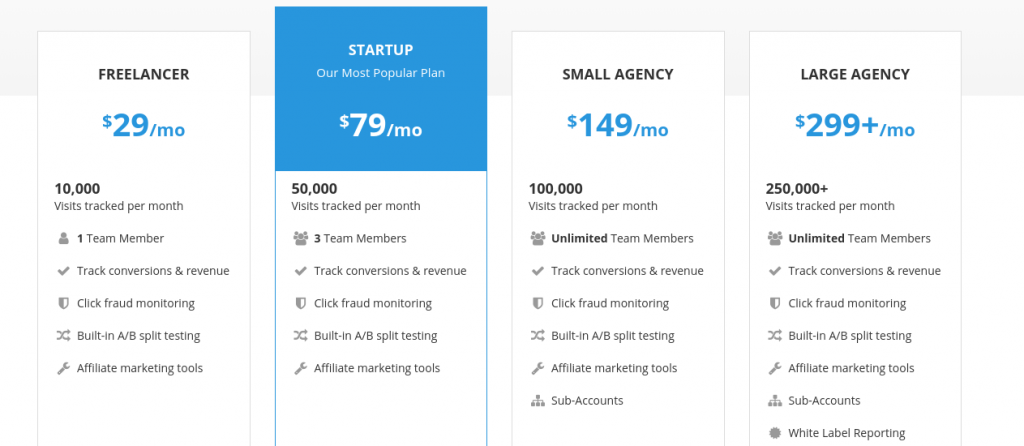
Improvely is not free, although it does offer a 14-day free trial. Here is their pricing scheme:
- Freelancer – $29/month: All of the basics, 10,000 visits per month, and one team member
- Startup – $79/month: 50,000 visits/month, three team members, and sub-accounts
- Small Agency – $149/month: 100,000 visits/month, unlimited team members
- Large Agency – starting from $299/month: 250,000+ visits/month, white-label service
Remember that you can track as many sites as you want with any plan.
As you can see, however, Improvely can get expensive quickly.
Once you start getting over 10,000 visits a month (which can be easily achieved if you are running large campaigns or simply have a large website or several websites), you are going to have to pay almost $1,000/year.
Wrapping It Up – Improvely vs Google Analytics
The main difference between Google Analytics and Improvely, besides GA being free, is that Google Analytics is more focused on site traffic data, while Improvely is more focused on conversions and geared towards marketers.
You will get a wide range of data with GA, as you can see.
However, Improvely makes trafficking conversions easier, offers customer profiles, allows for A/B testing, and has click-fraud prevention.
If you are running advertising campaigns, Improvely may be worth it for you.


