Building an app is the first step. Getting downloads and acquiring users is just the next step. Developing brand loyalty, engaged and returning customers and eventually ROI is another step forward in the success of your app.
But it is not the end, it is an iterative ongoing process of creating engaged users and customer retention, and the biggest question for every marketer and developer.
If you would like a deeper understanding of setting up Google analytics for your mobile app, we would encourage you to read this.
So I am going to skip the basics and dive straight to the winning reports that your business needs –
Acquisition Report – Where Are The New Users & Conversions Originating From?
Understanding acquisition of app users is the most critical factor in identifying the channel where your users are originating from, along with the total number of new users and conversions per browser and device.
If you would like to understand A-B-C of analytics, read “How to evaluate your mobile ecommerce website”
The report can be utilized to determine the top channel driving app downloads and conversions and eventually which marketing campaign is attracting more users.
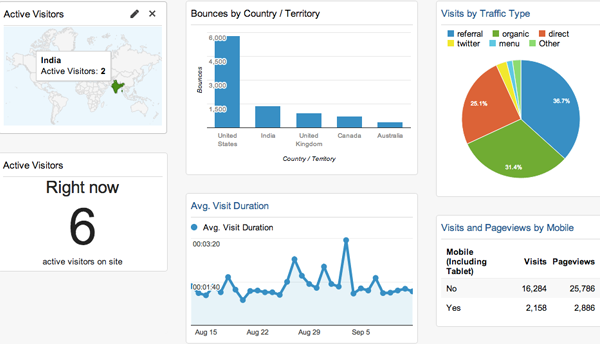
In this example of Google analytics acquisition overview report, data is organized according to a rule-based grouping of the top channels.
This report depicts that the highest conversions are originating from custom campaigns (Other channel) and the least from search engines (Organic search).
What do these top channels mean?
- Organic Search—Visitors who reach your app from a search engine search
- Direct—Visitors who reach your app without a tracked referral source, probably by directly typing your URL or using a bookmark on their browser
- Paid Search—Visitors who reach your app from a paid search advertisement.
- Referral—Visitors who reach your app from another website by clicking on a link
- Social—Visitors who reach your app from a social network like facebook or twitter
- Other—Visitors from custom campaign.
Worth Reading : How To Optimize Your Mobile App For Google Search
What does this report solve for?
- Who is downloading your app
- What channels are most effective at conversion
- What channels bring you the highest number of visitors
- What is the Customer Acquisition cost (CAC) or the cost of sales and marketing per new user over a given period of time.
- Calculate the Cost Per Loyal User (CPLU) that gives you a better idea of how much you need to spend to retain a loyal customer and generate revenues regularly.
- Understanding future acquisition to better plan resources and improve success rate of your app.
- ROI of sales and marketing acquisition campaigns to
App Performance Report– How Visitors Interact With Your App?
If your site is not performing well, you might be losing precious money and time.
It not only spoils user experience, but also reduces engagement, conversions and thus monetary goals.
The performance report shows how well your visitors are interacting with your app and their problem areas.
There is a vast set of usage metrics that you can use, including:
- Sessions – Total number of sessions and percentage of total sessions per operating system or per device.
- Screens – Total number of screens and their order per visit. It helps to evaluate the performance of each screen.
- Bounce Rate – For all pages that start with a particular page under consideration, bounce rate is the percentage that were only one of the session.
- Crashes and Exceptions – The name and description of technical errors, including app crashes and exceptions
- Time in App – The total amount of time a user spends on your app in a given interval of time.
- Downloads and Uninstalls – They are important in understanding how well your app is performing.
- Session Duration – Different from Time in App, it means that the time spent in using the app per interaction, which is the total time between the first and final activity.
Related : Reasons Why People Abandon Your App
There are more metrics like Lifetime Customer value, feature usage and more. If you combine these metrics and analyze, you will be able to better evaluate the user engagement and thus serve them better.
What does this report solve for?
- How different errors affect sessions duration and bounce rate
- Performance of each screen and how often visitors exit from a screen
- Time user spends in your app is directly proportional to their likeness for your app.
- Identify bottlenecks that are lowering conversion rate and disengaging users
- How to prioritize errors for fixing.
Mobile App User Segment – What Group Is Using The App & How To Identify The Most Profitable Segment
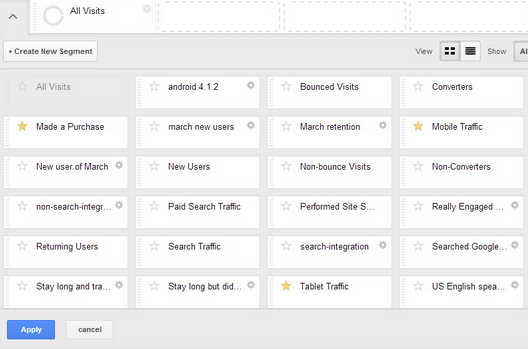
Segmenting the users to create groups based on traffic source, geographic location, device, demographics and behavior not only helps you better analyze the data in groups but also helps in targeting users with more engaged and customized campaigns while remarketing.
A segment is a subset of your isolated data that you are set to analyze in a more focused way and take appropriate action according to the component trend.
For instance, if a group of users of certain age are no longer buying an otherwise popular product, that means you need to check if the item has any issues or the prices are not competitive enough or something on similar lines.
Some examples of what you can include in the report –
Who is visiting your website, segment based on traffic source, visitor type, device type
- Single or multi-session user segmentation to find out the frequency of users.
- Segment based on bouncer information to find out if they have a longer session or leave immediately?
- Goals and transaction to find if the users convert or not?
- Segment users and sessions based on one of the different segment types like Demographics (age, gender and interests), technology, and behavior, date of first visit or traffic sources (if you are using Google analytics)
- You can create custom segments based on traffic source like from social media channels, search engines, and other channels to analyze and determine the traffic with the best efficiency.
- You can create custom segments for different gender groups to see which pages they visit most, their monetization behavior, degree of usage and session length and its reason.
- You can create custom segments for defined keywords that you need to analyze on AdWords.
- You can create custom segments for various campaigns you are monitoring with UTM parameters.
What it solves for?
- Understanding user behavior like who uses the app most, which segment offers most goal conversions.
- How to create more engaging content and offers based on the understanding of users
- How to create revenue generating messaging campaigns specific to each segment
- Calculate conversions rate, traffic trends and performance per browser
- Segmenting based on ecommerce helps you identify users who help in generating most revenue and distribution of transactions.
Related : App Marketing Tips & Tricks
Funnels – What Is The Conversion Rate On Goals?
A funnel is a streamlined flow or a series of steps that users take to accomplish a given task in you app.
App marketers and developers want to keep a tab on your performance at engaging, retention, conversion and monetizing by reporting on funnels.
Apps can have more than one funnel, like on registration process, sales and marketing process and more.
Explicitly defining these flows and monitoring user progression through funnel helps in establishing primary conversion goal, calculating conversion rate and eventually focusing their efforts to meet the goal.
The image (courtesy Apsalar) shows a Funnel Report of an app at different process steps –
What you could include in the report?
The most imperative step to improving boost your conversion rate is identifying funnels in your app and closely monitoring them.
- Build a funnel by establishing events and steps leading towards the ultimate goal
- Segment based on user behavior or demographics
- Calculate the conversion and drop-off rate to compare with the new reports
What it solves for?
- What are the bottlenecks in your process that is causing dropouts and lowering your conversion rate
- Helps in identifying variations in an app process that can improve user experience and retention
- Figuring out funnel generating most revenue
- Based on user behavior, identify if there are distractions (like ads, links or errors) at the narrow end of the funnel which could have been lowering conversions and increasing drop-offs.
Interesting Post : Best Mobile Conversion Optimization Tricks
User Loyalty Report – How Engaged Are Your Users?
We know that getting a user to download your app is the beginning of the journey. The most important aspect to long term retention, brand lovability and more downloads, is user engagement.
Based on the frequency of returning users to your app in a given period of time, marketers can understand the interest users have in your app.
This understanding is important in aligning your marketing and development efforts to engagement and retention.
What metrics to include?
- Number of sessions
- Average session duration
- Number of screens per session
- The goal conversion rate
Worth Reading :
- Best Practices For Engaging & Retaining Mobile App Users
- Key Metrics For Measuring User Engagement For Mobile Commerce Apps
What it solves for?
- Helps to understand that user with fewer sessions have lower conversion rates
- Helps to identify reason for disengaged users which could be a technical error or some distractive ad link.
- Segmentation to investigate and identify more reasons for lower conversion rate
- Assists in planning promotions and offers for less loyal customers.
If you want to learn more about how to design the mobile app and get maximum benefits, check out our blog post Strategic Roadmap For Designing Your Mobile App – Get Maximum Business Benefit And End-User Adoption.


